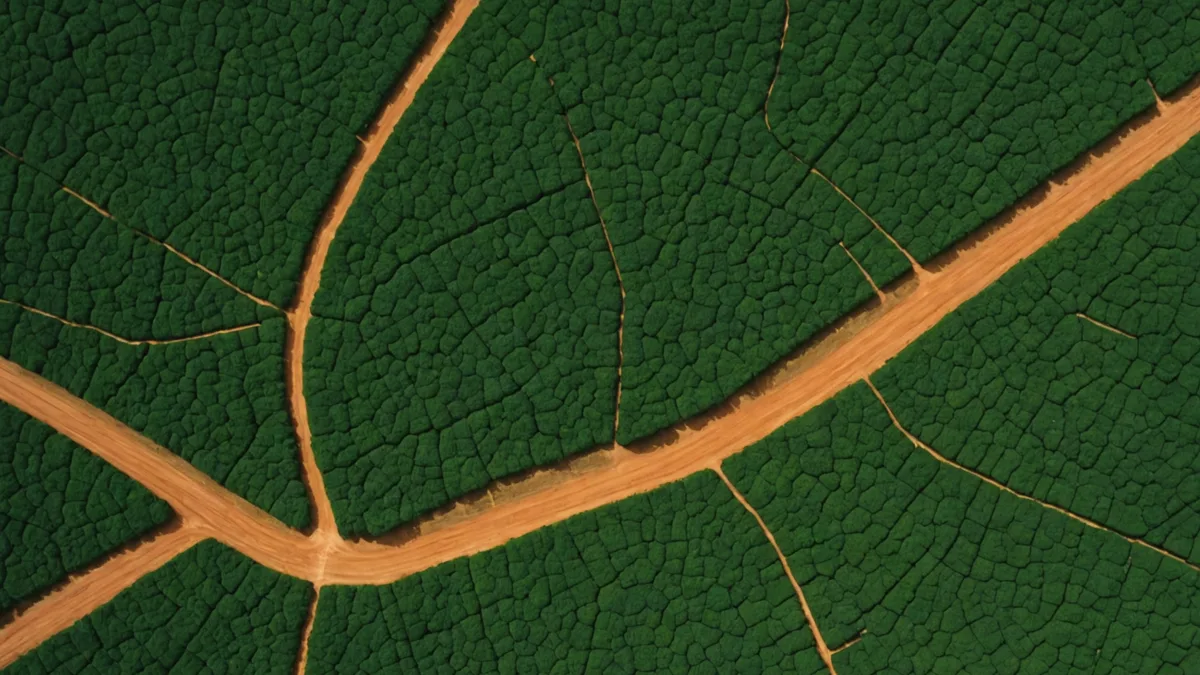
The arc of deforestation in Brazil has been documented for decades, but the specific dynamics of the Amazon-Cerrado transition zone remain poorly understood by most monitoring efforts. This isn't a single forest type giving way to a single crop — it's a mosaic of biomes, tenure situations, and clearing motivations stacked against each other at a frontier that shifts every dry season. What 2025 change data shows, when you actually look at it pixel by pixel across the Matopiba region and the southern Pará arc, is that the story has gotten considerably more complicated than "soy is eating the Amazon."
We spent the second half of 2025 building out our change detection coverage across this region with particular attention to the transition zone, running Sentinel-2 multispectral time series alongside Sentinel-1 SAR for the cloud-heavy wet season windows. This post is an attempt to document what the spectral evidence shows — not an advocacy piece, but a technical account of the patterns we're seeing.
What "Transition Zone" Actually Means Spectrally
The Amazon-Cerrado ecotone isn't a clean line on a map. In Mato Grosso, Tocantins, and Maranhão, you have intact cerrado sensu stricto (open savanna woodland) adjacent to cerradão (denser woodland that spectrally resembles closed forest), adjacent to gallery forest along watercourses, adjacent to actual Amazonian humid forest — all within a single Sentinel-2 tile. Each of these has a different spectral baseline in the NIR and SWIR bands, which means a single NDVI threshold for "forest" produces a different classification depending on which vegetation type you're looking at.
This matters enormously for deforestation counting. Cerrado clearing events produce a different spectral signature than humid forest clearing. After clearing, cerrado vegetation rebounds in NDVI more quickly than post-clearing Amazon forest, because the cerrado species pool has co-evolved with fire disturbance for millions of years. A system calibrated on Amazon clearing rates will undercount cerrado loss simply because the post-disturbance NDVI recovery is faster — sometimes returning to near-baseline within a single wet season.
Our approach in this region uses band combination differencing across NIR (Band 8, 842nm), SWIR1 (Band 11, 1610nm), and SWIR2 (Band 12, 2190nm) rather than a single index. The SWIR2 channel is particularly diagnostic for distinguishing active clearing from fire scar or seasonal moisture stress — cleared mineral soil has a characteristic SWIR2 reflectance peak that neither dry-season cerrado senescence nor burn scar produces in quite the same way.
Seasonal Clearing Patterns in 2025
In 2025, the peak clearing window in the southern Amazon arc ran from late May through early September — broadly consistent with prior years, but with some notable geographic shifts. The heaviest concentration of new clearing polygons we detected was not in Mato Grosso, which has relatively stronger environmental governance infrastructure, but in the southern Pará municipalities that sit at the edge of the PRODES assessment zone.
A few patterns stood out:
- Geometric versus irregular boundaries. About 68% of the clearing events we detected in the transition zone had straight-edge geometries consistent with mechanized land preparation — soy or cattle pasture conversion planned in advance with GPS-guided equipment. The remaining fraction had irregular, sinuous edges more consistent with smallholder clearing or fire-driven encroachment. These two categories behave very differently in NDVI time series; the mechanized events show a near-instantaneous NDVI drop across the entire cleared polygon, while fire-margin events show progressive expansion over multiple Sentinel-2 passes.
- Secondary clearing around older disturbances. A meaningful share of 2025 events were not primary forest clearing but incremental expansion adjacent to parcels cleared between 2018 and 2022. The pre-existing cleared land reduces the spectral contrast that makes new clearing easy to detect — you're looking for a change against a background that's already partially degraded. We had to tune our change-pair selection to use the most recent intact-vegetation baseline rather than a fixed historical composite.
- Dry-season cloud persistence in Maranhão. 2025 brought persistent cloud cover over eastern Maranhão in July, which is usually part of the reliable dry-season optical window. We fell back to Sentinel-1 C-band SAR for those tiles during that period. The SAR backscatter coherence loss over newly cleared areas is detectable even under cloud, though the spatial precision at 10m is slightly degraded compared to Sentinel-2 optical.
The Soy Frontier and Atlantic Forest Remnants
One aspect of the transition zone that often gets lost in aggregate statistics is the role of Atlantic Forest remnants. The Atlantic Forest biome once extended from the Brazilian coast well into the interior, but has been reduced to roughly 12% of its original extent. Isolated remnants persist along river corridors in Bahia, Minas Gerais, and into the transition zone — classified under Brazilian law as Areas of Permanent Preservation (APPs) along waterways and slopes.
In 2025, we detected a number of clearing events in what we classified as putative APP zones in the transition region — areas within 30-50 meters of watercourses where the Brazilian Forest Code nominally prohibits clearing. Some of these are ambiguous: seasonal variation in the visible watercourse boundary means our automated stream-proximity classification carries uncertainty. We flag these as "potential APP violations" rather than confirmed, and recommend field verification before any enforcement or compliance action is taken.
The soy expansion dynamic in this zone is genuinely complicated. We're not saying soy is the only driver, or that all soy expansion is illegal — a large portion of the agricultural expansion in the Matopiba region has occurred on previously cleared Cerrado land, which sits in a different legal category than Amazon forest under Brazilian legislation. The spectral data doesn't tell you the legality of a clearing event; it tells you a clearing event happened, where, and approximately when. The legal determination requires tenure data and regulatory mapping that we layer on separately where it's available.
Spectral Complexity at the Forest Margin
One observation that's changed how we think about transition zone monitoring: the spectral heterogeneity immediately adjacent to the clearing frontier is often higher than in intact interior forest. The forest edge effect — increased light penetration, wind exposure, altered moisture regime — creates a spectral signature that persists for several hundred meters into the remaining forest. In high-resolution Sentinel-2 data, you can see this as elevated SWIR1 reflectance (moisture stress) and increased texture variance in the NIR band as canopy structure becomes more fragmented.
This edge spectral signature is useful as an early indicator: parcels where edge-effect spectral changes are progressing inward are under increasing pressure even before any clearing occurs. We've been using this as a secondary signal for prioritizing monitoring attention — if a polygon's interior forest is developing edge-effect spectral characteristics, something is changing in the surrounding landscape that warrants closer attention on the next satellite pass.
What 2026 Looks Like From Here
The dry season window that determines 2026 clearing rates won't fully open until May-June, but there are leading indicators. Sentinel-1 coherence patterns show increased vehicle and equipment movement on access tracks in several transition-zone municipalities that historically precede clearing — consistent with land preparation activity in the late wet season. We're watching approximately 340,000 hectares of intact transition-zone forest that our risk-scoring model flags as high-priority based on proximity to existing clearing edges, road infrastructure, and land tenure ambiguity.
That number is not a prediction. It's a monitoring priority — the area where satellite attention should be concentrated during the May-September window to catch clearing events quickly enough to be actionable. Whether or not each of those hectares ends up cleared depends on enforcement, commodity prices, weather, and decisions being made right now in Brasília and in individual land offices across three states.
The honest answer to "what does 2025 data show" is: the transition zone is under sustained pressure, the spectral signatures are getting harder to interpret as the landscape becomes more fragmented, and the tools we use to monitor it need to keep pace with the complexity of what's actually happening on the ground.