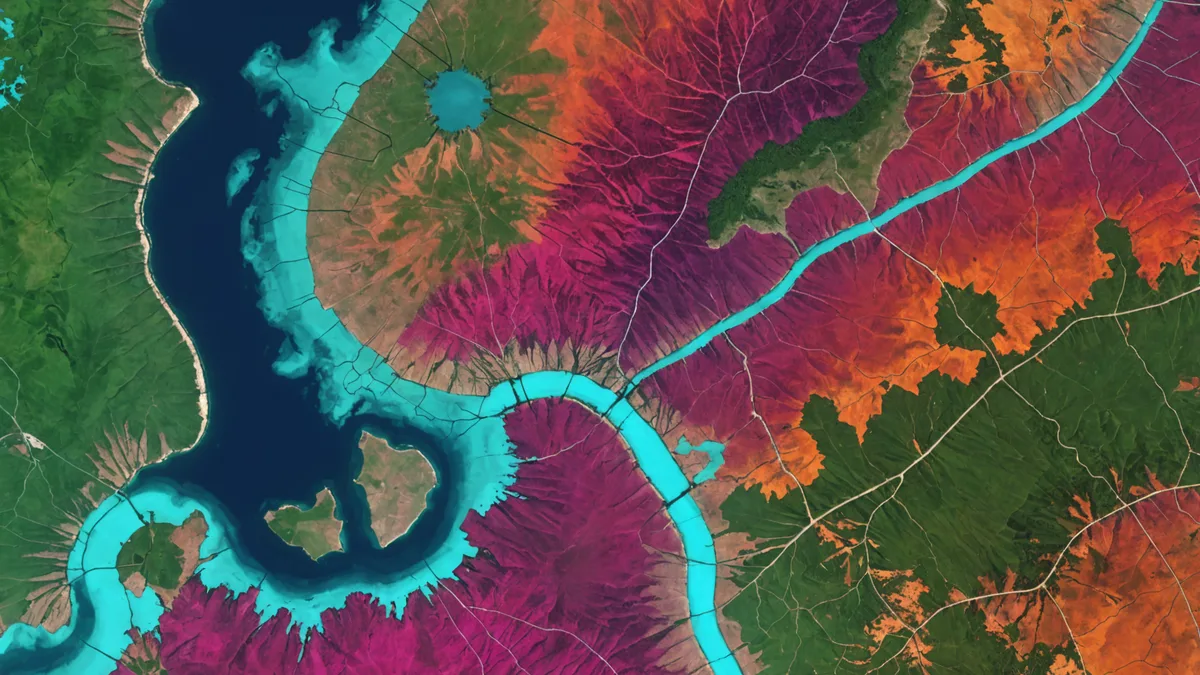
The first time a field ecologist encounters a false-color satellite image, the natural reaction is confusion. Healthy forest glows magenta. Bare soil appears cyan. Water turns jet black. Nothing looks the way it does from the ground, and the instinct is to dismiss it as a visualization artifact rather than a data product.
That reaction is understandable but worth overcoming. False-color composites are not aesthetic choices — they're purposeful remappings of spectral bands that make otherwise invisible ecological signals visible to the human eye. This guide is aimed at conservation practitioners who encounter these images in monitoring platforms, NGO field reports, or regulatory submissions and want to understand what they're actually looking at.
Why Color is Remapped: The Physics in Plain Language
A standard photograph captures red, green, and blue light — the bands our eyes are sensitive to. Satellites like Sentinel-2 measure reflectance across 13 spectral bands, including wavelengths the human eye cannot detect: near-infrared (NIR) around 842 nm, and shortwave infrared (SWIR) bands at 1610 nm and 2190 nm. These wavelengths carry enormous information about vegetation physiology, soil moisture, and burn damage, but they're invisible to us unless we remap them to visible channels.
False-color composites solve this by assigning non-visible bands to the red, green, and blue display channels. The specific assignments determine which ecological signals pop and which recede into background. Choosing the wrong composite for your question is like trying to read humidity with a thermometer — the sensor is capable, but you're reading the wrong output.
The Standard NIR Composite: Color-Infrared (CIR)
Band assignment: NIR (Band 8) → Red display, Red (Band 4) → Green display, Green (Band 3) → Blue display
Color-infrared is the classic false-color composite, developed in the film era when infrared-sensitive film was used for aerial photography. In CIR imagery, healthy vegetation appears bright red because it reflects strongly in NIR — a signal that maps to the red display channel. Stressed or sparse vegetation appears pink to light red. Bare soil appears in tan to brown tones. Water absorbs NIR strongly and appears dark blue to black.
Best for: Distinguishing dense healthy canopy from sparse or degraded vegetation; identifying active agricultural areas (crops at different growth stages appear different shades of red and pink); quick assessment of overall vegetation cover. CIR is the go-to for a rapid "is there vegetation here?" visual scan and is the most intuitive starting point for non-specialists because the pattern is relatively simple: more red = more live vegetation.
Limitations: CIR does not separate forest types well. Dense tropical forest and dense shrubland both appear bright red. It also doesn't discriminate between canopy moisture states clearly — a dry forest can still look comparably red to a moist one unless the stress is severe.
SWIR-NIR-Red Composite: The Deforestation and Burn Scar Standard
Band assignment: SWIR1 (Band 11, 1610 nm) → Red display, NIR (Band 8) → Green display, Red (Band 4) → Blue display
This is the composite we use most heavily in change detection work, and understanding it changes how you read monitoring outputs entirely. The key signal is in the SWIR channel. Mineral soil and recently exposed earth reflect strongly in SWIR1 — a 1610 nm signal that plant canopy largely absorbs through leaf water content. This means freshly cleared land, burn scars, and exposed agricultural soil all appear in bright reds, oranges, and pinks in SWIR-NIR-Red composites.
Intact healthy forest, because it has high NIR reflectance and absorbs SWIR, appears green to bright green in this composite. Degraded forest — where canopy density has dropped but some cover remains — appears yellow-green, capturing the partial NIR signal and partial SWIR exposure. Water remains very dark to black, since it absorbs across all three bands strongly.
A deforestation event is immediately visible in this composite as a transition from green to orange-red within a forest matrix. The color change is sharp and interpretable without needing to run any additional indices. For a field analyst reviewing a monitoring alert, a SWIR-NIR-Red composite of the flagged area tells the story in a single image.
Burn scars appear deep red to maroon in this composite (charred material reflects SWIR but not NIR), which makes it equally useful for wildfire impact assessment and post-fire vegetation recovery tracking. Fresh burn scars are very dark red; recovering areas progressively shift toward yellow-green as pioneer vegetation establishes and NIR signal recovers.
Best for: Deforestation detection and verification, burn scar mapping, distinguishing intact forest from cleared land, agricultural expansion monitoring.
SWIR2-SWIR1-NIR: Moisture and Soil Discrimination
Band assignment: SWIR2 (Band 12, 2190 nm) → Red display, SWIR1 (Band 11, 1610 nm) → Green display, NIR (Band 8) → Blue display
This combination is less common in standard conservation monitoring but highly useful for two specific applications: discriminating soil types in recently cleared areas, and identifying moisture stress in forest landscapes before it becomes visible as canopy dieback.
The physics: SWIR2 (2190 nm) is more sensitive to clay mineral content than SWIR1 (1610 nm), which is more sensitive to leaf and soil water content. In this composite, lateritic soils appear distinctly different from sandy soils in deforested areas — which can help analysts classify the land-use type that has replaced forest (bare earth awaiting planting looks different from actively tilled agricultural land). Forest moisture stress — where canopy water content is declining due to drought — appears as a shift in the blue channel (NIR) without obvious change in the red-green channels, creating a color signal that precedes structural canopy damage.
Best for: Drought stress mapping, soil type discrimination in cleared areas, pre-disturbance canopy moisture assessment. Less useful as a primary deforestation visualization tool because the color mapping is less intuitive than SWIR-NIR-Red.
NIR-Red-Green: The Vegetation Health Composite
Band assignment: NIR (Band 8) → Red display, Red (Band 4) → Green display, Green (Band 3) → Blue display
This is a minor variant of standard CIR but with an additional blue channel (Green band instead of Blue band). In practice it looks very similar to CIR — healthy vegetation still appears red — but the color range for different vegetation types is slightly broader. Tropical forest, temperate forest, and grassland separate more clearly because the green display channel adds phenological information (the ratio of red to green reflectance varies with plant functional type and growth stage).
Aquatic environments appear more distinctly blue in this composite than in CIR, which can be useful when mapping wetland extent adjacent to forested areas.
Best for: Regional vegetation type mapping, separating forest from savanna or grassland, wetland-forest boundary delineation.
Choosing the Right Composite for Your Question
The practical guidance is straightforward once you've internalized the band physics:
- Did deforestation occur here? → SWIR-NIR-Red. Fresh clearings are immediately visible as orange-red against green forest.
- How much healthy vegetation cover is there? → CIR or NIR-Red-Green. Bright red = dense live canopy, gradation toward pink and tan indicates degradation or sparseness.
- Was there a fire here, and how is it recovering? → SWIR-NIR-Red. Fresh burn scars are dark red; recovery shifts progressively to yellow-green as NDVI rebuilds.
- Is the forest under moisture stress? → SWIR2-SWIR1-NIR. Changes in the blue channel signal water content decline before visible damage.
- What land-use type replaced the forest? → SWIR2-SWIR1-NIR or SWIR-NIR-Red. Soil type and moisture state of the cleared area help distinguish bare earth from active crops.
What False-Color Cannot Tell You
False-color composites are an interpretive tool, not an analytical result. They're excellent for visual inspection, rapid scene assessment, and communicating findings to non-technical stakeholders (a SWIR-NIR-Red image of a deforestation event with the clearing rendered in vivid orange tells its own story in a slide deck). They do not replace quantitative analysis.
We're not saying false-color visualization is sufficient for change detection. A manual visual review of a 40,000-hectare monitoring area using false-color imagery will miss clearings smaller than a few hectares, will be inconsistent across analysts and time periods, and cannot be archived as a systematic evidentiary record. The role of the visual composite is to make algorithmic detections interpretable and to let analysts rapidly confirm or dismiss flagged areas.
The pipeline is: automated spectral index change detection identifies candidates → false-color composite of the flagged area allows rapid visual confirmation → confirmed events are archived as point records with coordinates, area, date, and confidence score. The visual review step takes 30–60 seconds per flag and is critical for catching algorithmic errors, but it works because it's applied to a pre-filtered set of high-confidence candidates, not as a primary scanning tool across millions of pixels.
A Note on Atmospheric Correction
One practical consideration for teams using satellite imagery directly from data portals: always work with Level-2A surface reflectance data, not Level-1C top-of-atmosphere radiance. False-color composites of Level-1C data look similar to Level-2A at a glance, but the absolute reflectance values differ because Level-1C includes atmospheric scattering effects — haze, aerosols, thin cloud — that artificially elevate visible band values and suppress the NIR/SWIR contrast that makes false-color interpretation reliable.
Sentinel-2 Level-2A products are available directly from the Copernicus hub with Sen2Cor atmospheric correction applied. For most conservation monitoring applications, these are the correct starting data. If you're seeing washed-out, low-contrast composites where healthy forest doesn't appear convincingly red or green, the first diagnostic question is whether you're working with Level-1C instead of Level-2A data.