The soundscape of a healthy riparian forest sounds nothing like the soundscape of a degraded one. That statement seems obvious to anyone who has spent time in both environments — the difference is visceral and immediate. What ecoacoustics has accomplished over the past two decades is to make that difference mathematically tractable, reproducible, and amenable to automated monitoring at scale. For biodiversity credit verification, this matters enormously.
What Soundscape Indices Actually Measure
Acoustic indices are statistical descriptors computed from audio recordings that quantify different properties of a soundscape's structure. They are not direct species counts — they do not tell you that a Pacific wren (Troglodytes pacificus) is present. What they tell you is something about the complexity, temporal distribution, and spectral distribution of biological sound in an environment, which correlates empirically with the diversity and abundance of vocalizing organisms.
Three indices are central to our monitoring framework:
- Acoustic Complexity Index (ACI) — quantifies the variability in intensity across frequency bands over time. In high-diversity vocal communities, the ACI is elevated because multiple species vocalizing at different frequencies and temporal patterns produce a heterogeneous signal. Monoculture soundscapes dominated by single-species choruses or abiotic noise have characteristically lower ACI values.
- Normalized Difference Soundscape Index (NDSI) — partitions acoustic energy between the biophony band (approximately 2–8 kHz, where most vertebrate vocalizations occur) and the anthrophony band (below 2 kHz, dominated by wind, traffic, and machinery). A high NDSI value indicates a site where biological sound dominates the soundscape — a useful proxy for remoteness from anthropogenic disturbance and for auditory habitat quality for sensitive species.
- Acoustic Diversity Index (ADI) — computes Shannon diversity applied to the spectral distribution of sound energy across frequency bins. It rewards even distribution of acoustic energy across the frequency spectrum, which tends to occur when many species occupying different acoustic niches are actively vocalizing simultaneously.
A fourth index — Bioacoustic Index (BIO) — captures the amplitude envelope of the biophony band specifically and is particularly sensitive to changes in amphibian chorus density in wetland systems, which we use for our Willamette Valley wetland monitoring sites.
Correlation with Species Richness: What the Literature Shows
The empirical basis for using acoustic indices as biodiversity proxies is now well-established. Studies in temperate forests, tropical systems, and coastal grasslands have consistently found positive correlations between ACI, ADI, and independently-measured species richness. The relationship is not perfect — acoustic activity is time-of-day and seasonally dependent, and species that are present but not vocalizing are acoustically invisible.
This is why we are careful to position acoustic indices as a complementary layer to eDNA, not a replacement for it. eDNA captures the full community of organisms leaving genetic material in the water column or soil, including species that are cryptic, non-vocal, or nocturnal. Acoustic monitoring captures the temporal dynamics of the vocalizing community, with daily and seasonal resolution that eDNA sampling (typically quarterly or biannual) cannot provide. Together they are substantially more informative than either alone.
Acoustic data provides a continuous monitoring signal between eDNA sampling campaigns. A site might be sampled for eDNA twice a year; an AudioMoth recorder running on scheduled duty cycles provides 24/7 coverage at roughly $70 in hardware cost.
Practical Deployment: Our Pacific Northwest Protocol
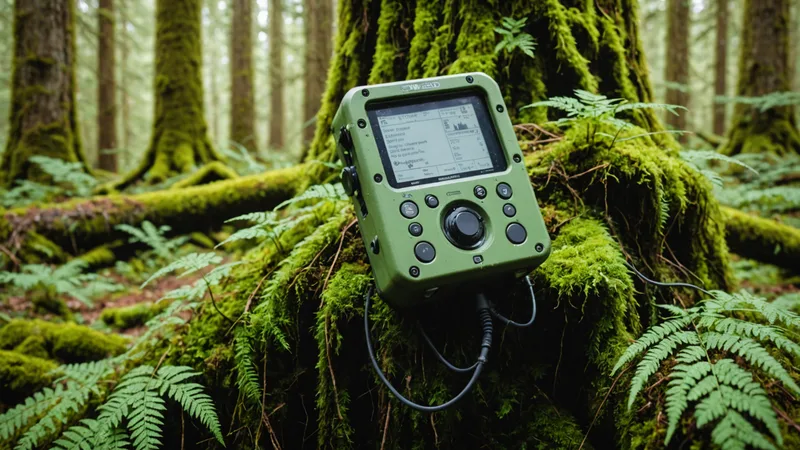
For a typical enrolled riparian site in the Oregon Coast Range or Willamette Valley, we deploy three to five AudioMoth devices at 1-km intervals along the restoration corridor. Recorders run on scheduled duty cycles — one minute of recording every ten minutes during dawn and dusk windows, with additional overnight cycles during spring amphibian breeding season. Each device runs on AA batteries for approximately four to six weeks between service visits, depending on temperature and duty cycle.
Raw audio files are transferred during eDNA field visits (which occur at the same cadence), processed through our acoustic analysis pipeline, and indexed against site-specific baselines. The BHI acoustic component is calculated as a composite of ACI, NDSI, and ADI values normalized against baseline values established during the initial site enrollment survey. A restored site showing acoustic index improvements of 15% or more across all three indices relative to pre-restoration baseline constitutes a meaningful biodiversity uplift signal — one that we treat as supporting evidence for eDNA-confirmed species recovery.
Limitations and Appropriate Expectations
We are not saying acoustic indices can replace species-level measurement. They cannot. A site could show elevated ACI due to a single highly vocal invasive species dominating the soundscape — European starlings producing a complex soundscape that scores well acoustically while suppressing native cavity-nesting species. Without eDNA data to confirm actual community composition, acoustic indices can be misleading in precisely the environments where ecological fraud is most tempting to commit.
This is why the BHI framework uses acoustic indices as a temporal continuity signal — useful for detecting degradation between formal sampling campaigns and for flagging sites where acoustic conditions are deteriorating faster than the eDNA evidence would suggest — but not as the primary evidence source for credit issuance. Credits are issued and re-verified on the basis of eDNA community data. Acoustic data contributes to the scoring confidence interval and triggers early-warning reviews when index values decline unexpectedly.
The combination matters for another reason: it raises the cost of gaming the system. A restoration project that has artificially inflated eDNA results (contaminated samples, selective filtering of the taxonomic pipeline) is unlikely to simultaneously produce a plausible acoustic profile. And a project that has manipulated acoustic recorders is unlikely to have done so in a way that generates consistent species detections from eDNA. Dual-method verification forces correlation between independent evidence streams — which is exactly what a credit market that takes ecological integrity seriously requires.
What This Means for Monitoring Timelines
One practical advantage of acoustic monitoring that often goes underappreciated is its capacity for near-real-time ecosystem health surveillance between formal credit re-verification events. BHI scores are formally re-certified on an annual basis, with full eDNA campaigns and acoustic data analysis. But between certifications, continuous acoustic monitoring provides a leading indicator — if a site undergoes disturbance (logging activity nearby, hydrological alteration, a major flooding event), acoustic index divergence from expected seasonal patterns will appear in the data within days.
For credit buyers concerned about permanence, this matters. A purchased credit that is subject to ongoing acoustic health monitoring at the underlying site represents a stronger claim to durability than a credit backed only by an annual snapshot eDNA survey. The monitoring infrastructure is not infallible, but its presence signals a seriousness about ongoing ecological accountability that purely paper-based offset programs structurally cannot match.